
Two hours south of Nairobi, Kenya, is an enormous watershed that supplies most of the water used in the capital city and the surrounding agricultural area — that is, until it runs out. There’s a growing risk that the basin will be depleted by the water needs of a growing population and agricultural industry.
Associate Professor Carolina Castilla is part of a team trying to plan ahead. The developmental and behavioral economist, along with a diverse team of experts, is studying and discerning the best ways to conserve water. But effective policies require a deep understanding of current rhythms. To conserve one of Kenya’s major water sources, Castilla says we first have to understand how it’s being used. And that means taking on the challenge of measuring human behavior.
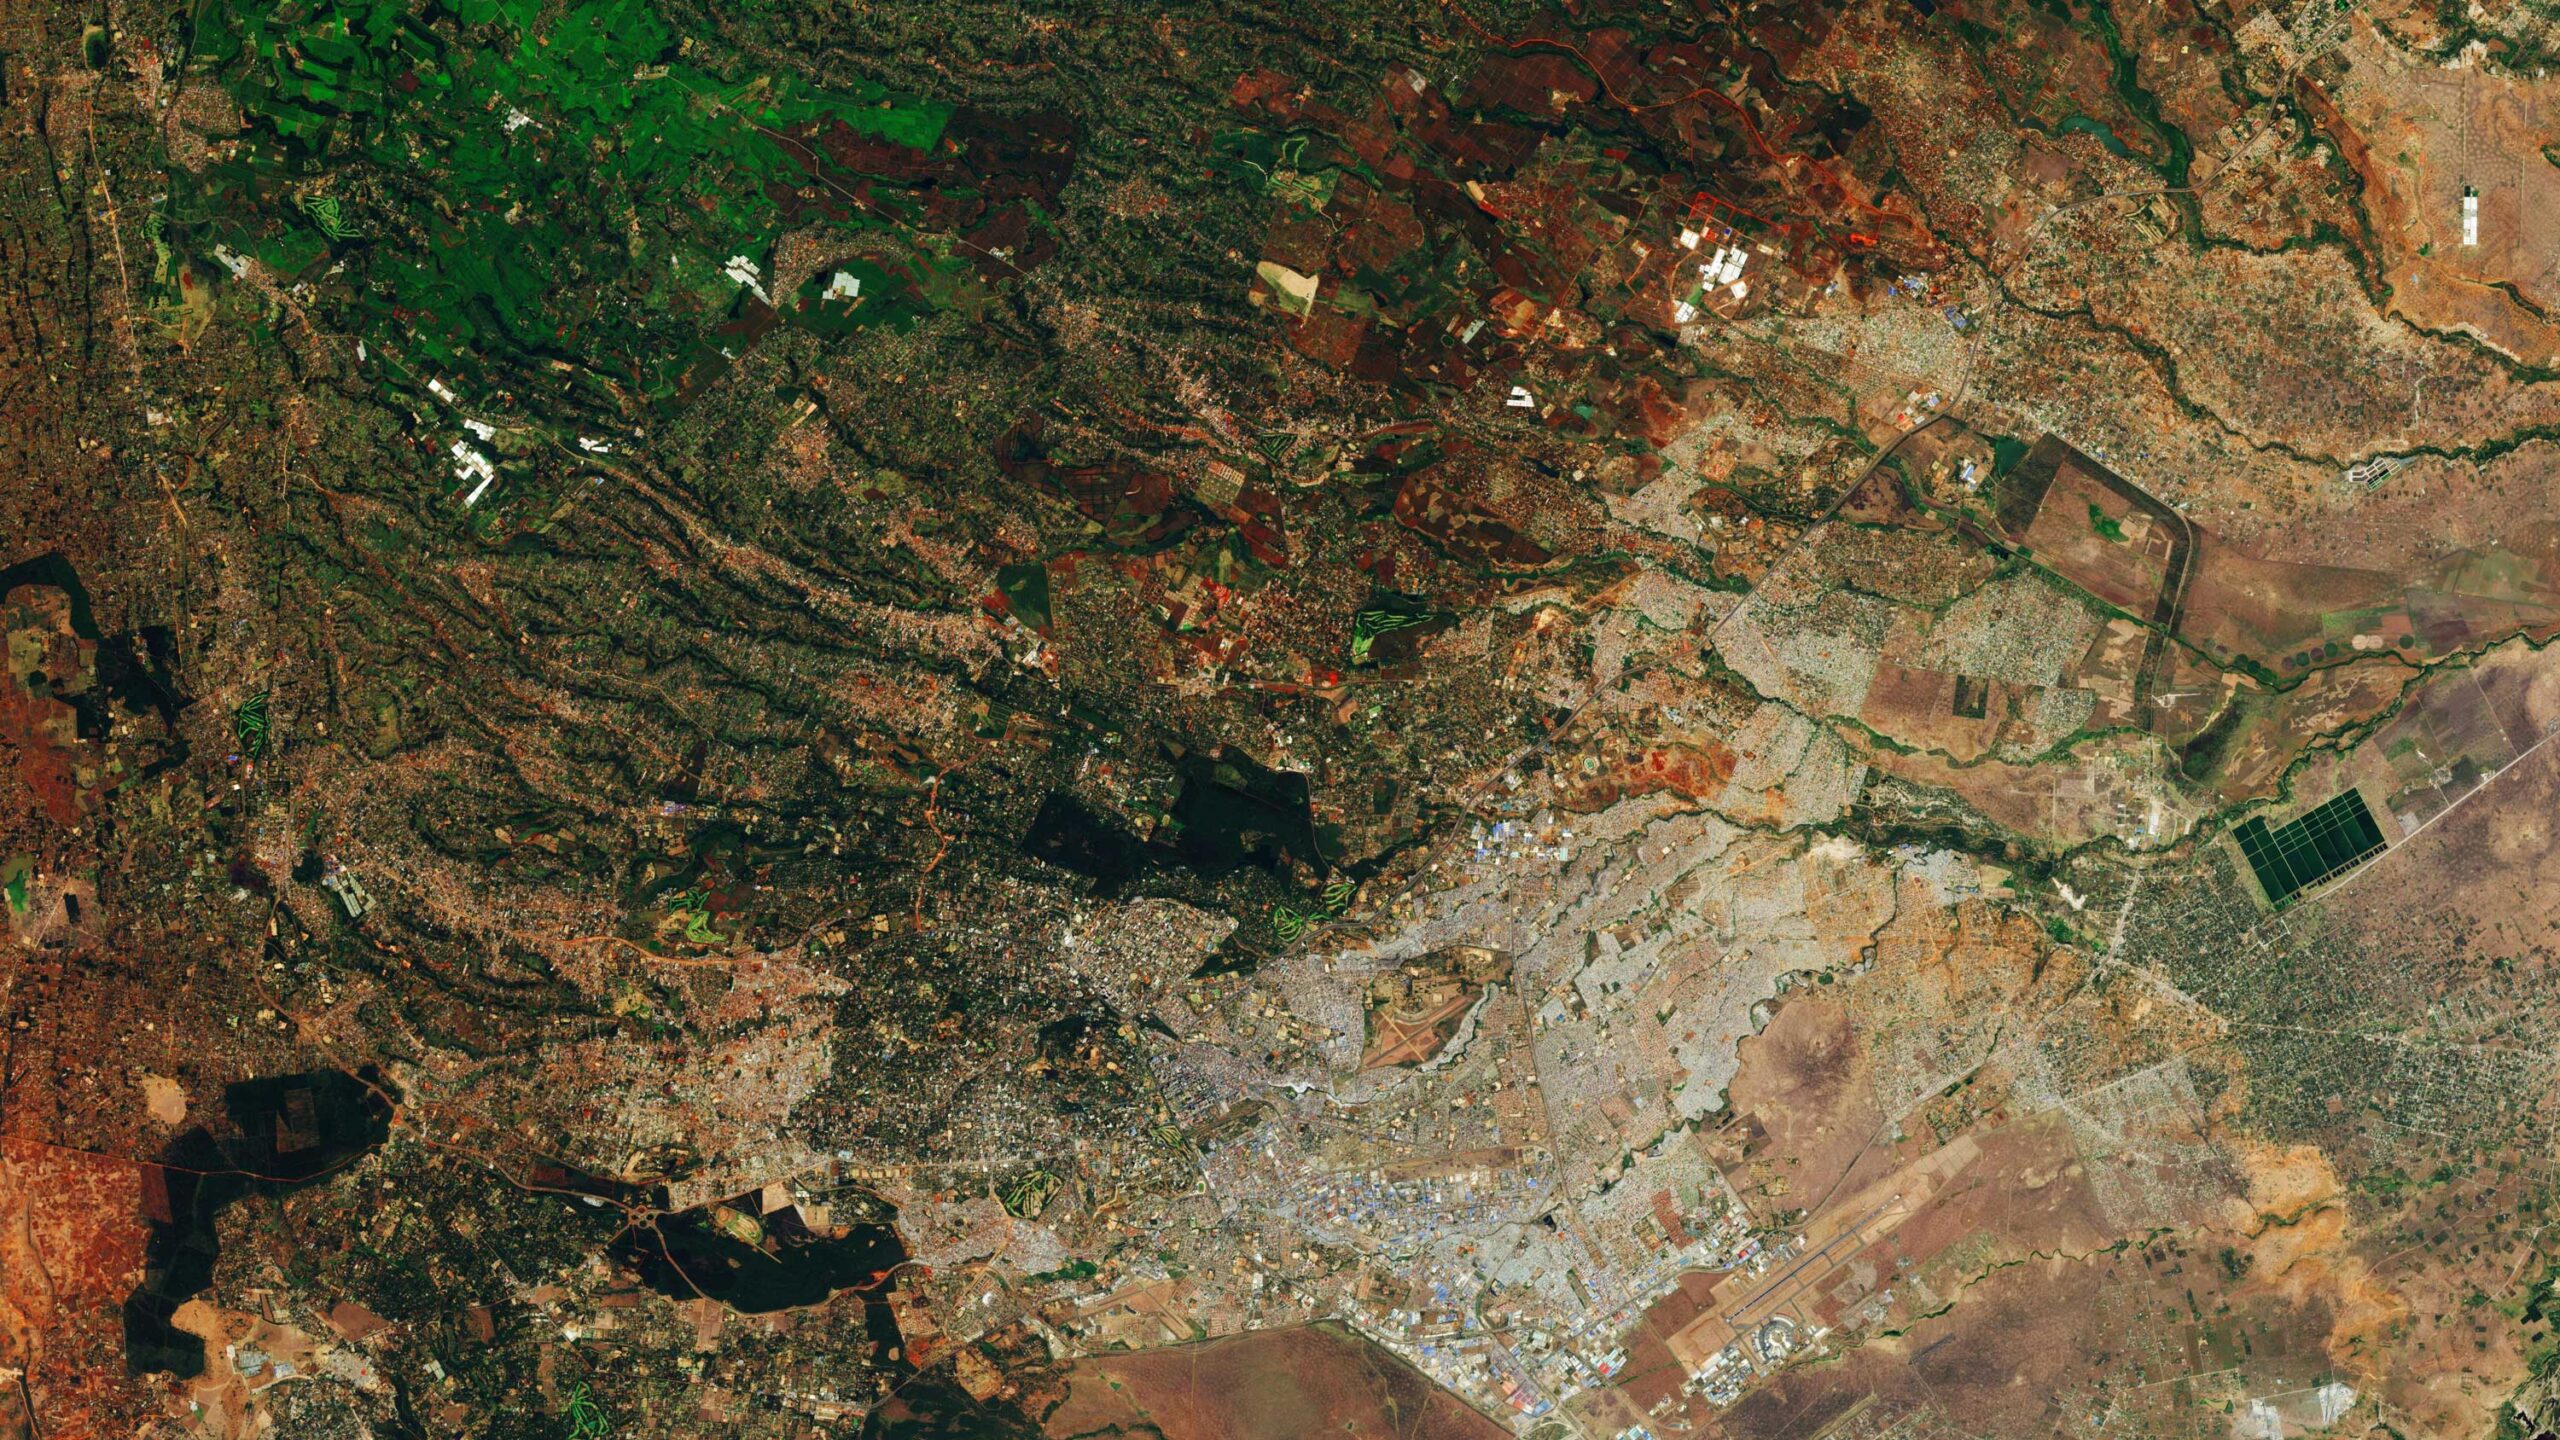
In a new study published in the Journal of International Development, Castilla and her colleagues used satellite imaging to measure Kenyan farm plots. Understanding land size is critical to accurately measuring yield and the productivity of inputs like water.
More than 375 million households worldwide rely on small farms for their food and livelihood, according to the Food and Agriculture Organization. The most common way to measure plot size to date is by surveying the farmers, “but there is a clear cost to relying only on self-reported survey questions: lower reliability and accuracy,” Castilla and her colleagues write in their paper. Farmers often misjudge their boundaries or they round up the number of hectares they farm in a survey (0.3 hectares might be reported as 0.5). This slants the yield calculations used to understand farm productivity and inform policy.
So to compensate for possible inaccuracies, Castilla’s team surveyed land-holders but also showed them a high-resolution satellite image of the land around them on a tablet. Farmers were asked to draw the boundaries of their land on the tablet based on familiar landmarks in the image like their home, local school, roads, rivers, and landscape markers like trees or vegetation. Using satellite data is not a new idea. It’s been in the works for a couple of decades, but only recently has the resolution and equipment become available to researchers.
The researchers surveyed 540 households from 68 villages in the Upper Tana River basin, most of which were farmers who reported owning on average 1.68 acres. The idea was to compare the survey data and the plots drawn on the tablet to identify inconsistencies. Of the 540 households, 70% could draw at least one of the plots they maintained — 376 households were able to draw 744 plots. Farmers who owned their land and lived near their land were most likely to be able to do so.
Almost 90% of the farmer-drawn maps were fairly accurate, not overlapping with other plots and aligning well with imaging of the land. However, farmers were not as accurate at estimating their field or plot size in the survey — the smaller the plot, the less accurate their estimate. Thus, Castilla found that the high-resolution satellite imagery method works best for those farmers.
A development economist interested in gender, Castilla expected there to be some difference by gender or age in how effectively farmers engaged with the satellite data. “Women usually farm plots that are closer to their home, but also tend to have lower levels of education than men,” Castilla says. “Therefore it was unclear, a priori, whether women would more accurately report plot sizes and/or interact with the satellite images and tablets.”
To her surprise, their data found that a person’s characteristics didn’t predict how well they represented their land. Young and old, men and women, all were up to the task. But a person’s involvement or investment in their land significantly affected their ability to draw their plots.
“It’s kind of intuitive. If they work on their land, they will know it better,” Castilla says.
In addition to plot characteristics, the survey also asked about household demographics, agricultural practices, water treatment, conservation practices, intrahousehold decision-making, and other topics. The surveys have their shortcomings, and the push for more accurate and affordable ways to measure land use, resource use, and human activity inevitably points to technology, Castilla says, but people and their local knowledge shouldn’t be overlooked.
“The farmers have an intricate knowledge of their land,” she says. Maybe the farmers couldn’t give the precise number of hectares they worked, but they knew where to plant barrier shrubs to prevent landslides. They might not calculate their yield in scientific units, but they knew how to divvy up their land so that they had the most food and income for their family. “A combination of tech and the information the farmers have is a better way to get plot sizes and their characteristics,” Castilla said.
This research was really only the beginning, testing the satellite approach to see if it was a more efficient way to measure plot size. Moving forward, the team will combine the plot data with other household factors to better understand water use and productivity in the region.
Castilla and her team write that their combination of spatial data from the satellite images with local knowledge collected in the survey is a scalable alternative to existing, time-consuming methods. “The increasing quality of freely available satellite imagery also creates new possibilities and greater accuracy for identifying small agricultural plots using RDPM,” they continue. Either method captured data the other did not — like satellite imaging revealed sustainable practices that weren’t included in the surveys. Used together, they give a clearer idea of land use near the Tana River basin. And that data can be “used to measure agriculture productivity and evaluate policies that benefit these households,” Castilla says.